HR Metrics: Your Guide to Data-Driven HR Success
In today’s rapidly evolving business landscape, Human Resources (HR) departments are increasingly turning to data-driven approaches to enhance their decision-making processes and drive organizational success. At the heart of this transformation lies the concept of HR metrics – quantifiable measures that help HR professionals and business leaders assess the effectiveness of various HR functions and their impact on overall business performance.
This comprehensive guide will delve into the world of HR metrics, exploring their importance, best practices, and how to leverage tools like Excel and Power BI to create intelligent HR systems. We’ll cover everything from recruitment metrics to employee engagement analytics, providing you with the knowledge and strategies needed to implement data-driven HR practices in your organization.
Understanding HR Metrics & Analytics
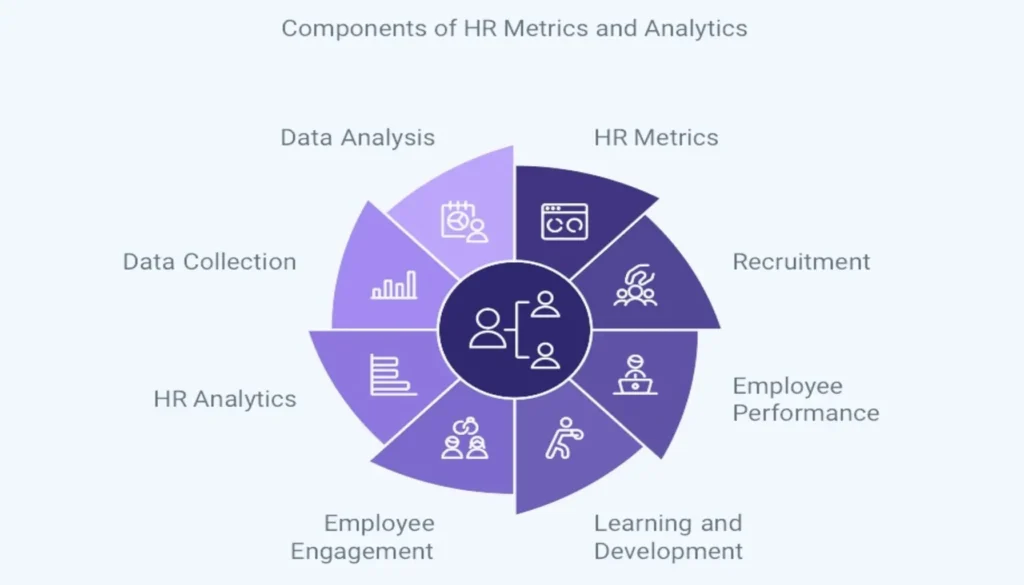
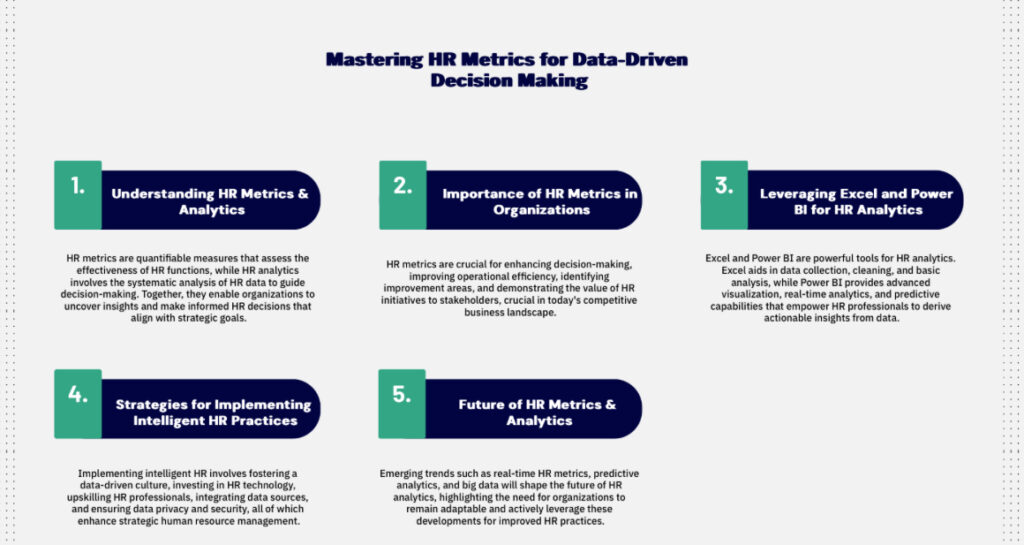
HR metrics are quantifiable measures used to track and assess the effectiveness of HR functions and their impact on business outcomes. These metrics provide valuable insights into various aspects of HR management, including recruitment, employee performance, learning and development, and employee engagement.
HR analytics, on the other hand, involves the systematic collection, analysis, and interpretation of HR data to make informed decisions and improve organizational performance. By combining HR metrics with advanced analytics techniques, organizations can uncover hidden patterns, predict future trends, and make data-driven decisions that align with their strategic goals.
What are HR Metrics and Analytics?
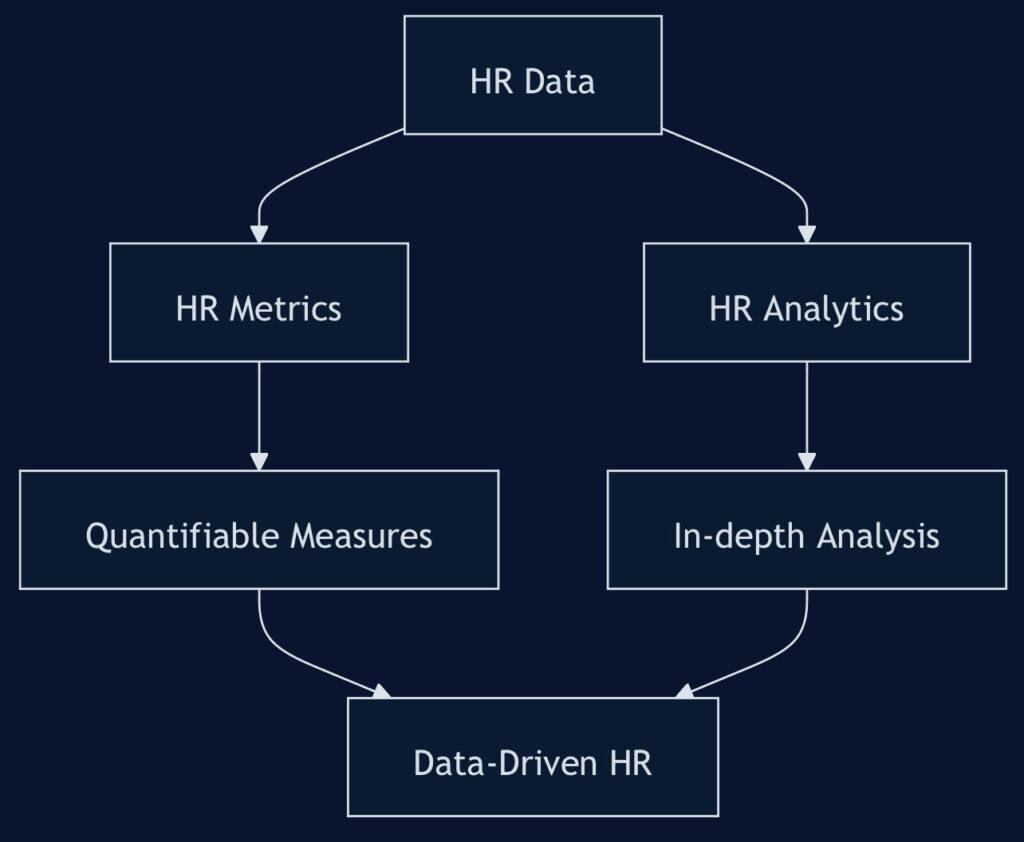
HR metrics are quantifiable measures used to track and assess the effectiveness of various human resources functions and their impact on overall business performance. These metrics provide tangible data points that help HR professionals and business leaders make informed decisions.
HR analytics, on the other hand, involves the systematic collection, analysis, and interpretation of HR data to identify patterns, predict trends, and generate actionable insights. It goes beyond simple measurement to provide a deeper understanding of the “why” behind the numbers.
Interactive HR Metrics Dashboard
To better understand how HR metrics work in practice, let’s take a look at this interactive dashboard. It showcases some key HR metrics and allows you to explore different aspects of HR analytics.
Interactive HR Metrics Dashboard
Employee Engagement
0%
Turnover Rate
0%
Time-to-Hire
0 days
This dashboard provides a snapshot of critical HR metrics such as employee engagement, turnover rate, and time-to-hire. You can also explore different charts showing recruitment metrics, performance management data, and learning and development statistics. This interactive element demonstrates how HR professionals can visualize and analyze data to make informed decisions.
| 📊 Metric | 📈 Impact | 📉 Usage | 📊 Adoption Rate |
| Recruitment | High | High | High |
| Performance | Moderate | Moderate | Moderate |
| Engagement | Low | Moderate | Moderate |
| Learning | Moderate | Low | Low |
The Importance of HR Metrics & Analytics in Modern Organizations
In today’s competitive business environment, HR metrics and analytics play a crucial role in:
- Improving decision-making processes
- Enhancing operational efficiency
- Identifying areas for improvement
- Aligning HR strategies with business objectives
- Demonstrating the value of HR initiatives to stakeholders
Why are HR Metrics and Analytics Crucial for Business Success?
- Data-Driven Decision Making: HR metrics and analytics provide objective data to support strategic decisions, moving away from gut feelings or assumptions.
- Performance Improvement: By tracking key performance indicators (KPIs), organizations can identify areas for improvement and measure the impact of HR initiatives.
- Cost Optimization: Analytics can reveal inefficiencies in HR processes, helping to reduce costs and allocate resources more effectively.
- Predictive Capabilities: Advanced analytics can forecast future trends, enabling proactive HR strategies.
- Employee Engagement: Metrics related to engagement and satisfaction help create better work environments and reduce turnover.
- Compliance and Risk Management: Analytics can help identify potential compliance issues and mitigate HR-related risks.
- Strategic Alignment: HR metrics ensure that human resources strategies align with overall business objectives.
Strategies for Creating Intelligent HR
Creating intelligent HR systems involves leveraging data, technology, and analytics to make informed decisions and drive organizational success. Here are some key strategies for implementing intelligent HR practices:
- Develop a data-driven culture: Foster a culture that values data-driven decision-making across all levels of the organization.
- Invest in HR technology: Implement advanced HR software and tools that can collect, analyze, and visualize HR data effectively.
- Upskill HR professionals: Provide training and development opportunities for HR staff to enhance their data analysis and interpretation skills.
- Integrate HR data sources: Combine data from various HR systems and processes to gain a holistic view of the workforce.
- Implement predictive analytics: Use advanced analytics techniques to predict future trends and make proactive HR decisions.
- Leverage artificial intelligence: Explore AI-powered HR tools to automate routine tasks and uncover deeper insights from HR data.
- Ensure data privacy and security: Implement robust data protection measures to safeguard sensitive employee information.
How HR Metrics Differ from Traditional HR Reporting
While traditional HR reporting and HR metrics may seem similar, there are significant differences:
| Traditional HR Reporting | HR Metrics |
| Focuses on past events | Includes predictive measures |
| Often qualitative | Primarily quantitative |
| Descriptive in nature | Analytical and actionable |
| Periodic reports | Continuous monitoring |
| Limited context | Benchmarked against industry standards |
| Departmental focus | Aligned with business objectives |
| Static data presentation | Interactive dashboards |
The Role of Excel and Power BI in HR Analytics
Excel and Power BI are powerful tools that play a crucial role in HR analytics:
Excel in HR Analytics:
- Data Collection: Excel’s forms and data entry features facilitate efficient data gathering.
- Data Cleaning: Functions like TRIM, PROPER, and Remove Duplicates help maintain data integrity.
- Basic Analysis: Pivot tables and charts enable quick data summarization and visualization.
- Statistical Analysis: Excel’s statistical functions support deeper data exploration.
- Reporting: Conditional formatting and sparklines create visually appealing reports.
Power BI in HR Analytics:
- Data Integration: Power BI can connect to multiple data sources, providing a holistic view of HR data.
- Advanced Visualizations: Interactive charts, graphs, and maps offer intuitive data representation.
- Real-Time Analytics: Power BI’s live connection feature enables up-to-date HR dashboards.
- Predictive Analytics: Integration with R and Python allows for sophisticated statistical modeling.
- Collaboration: Shared dashboards and reports facilitate team-wide data-driven discussions.
The Role of Data in Intelligent HR
Data plays a crucial role in creating intelligent HR systems. By leveraging HR data effectively, organizations can:
- Make informed decisions: Base HR decisions on empirical evidence rather than intuition or guesswork.
- Identify trends and patterns: Uncover hidden insights and correlations within HR data to guide strategic planning.
- Improve workforce planning: Use data to forecast future talent needs and develop targeted recruitment strategies.
- Enhance employee experience: Analyze employee feedback and engagement data to create more satisfying work environments.
- Optimize HR processes: Identify inefficiencies and bottlenecks in HR processes through data analysis and implement improvements.
- Measure ROI of HR initiatives: Quantify the impact of HR programs and initiatives on business outcomes.
- Support diversity and inclusion efforts: Use data to track progress towards diversity goals and identify areas for improvement.
By leveraging these tools, HR professionals can transform raw data into meaningful insights, driving intelligent HR practices and contributing to overall business success.
Link to Microsoft’s guide on using Power BI for HR analytics
Remember, while tools like Excel and Power BI are powerful, the real value comes from asking the right questions and interpreting the data in the context of your organization’s unique needs and goals. As you embark on your HR analytics journey, focus on developing a data-driven culture that values evidence-based decision-making and continuous improvement.
Creating Intelligent HR
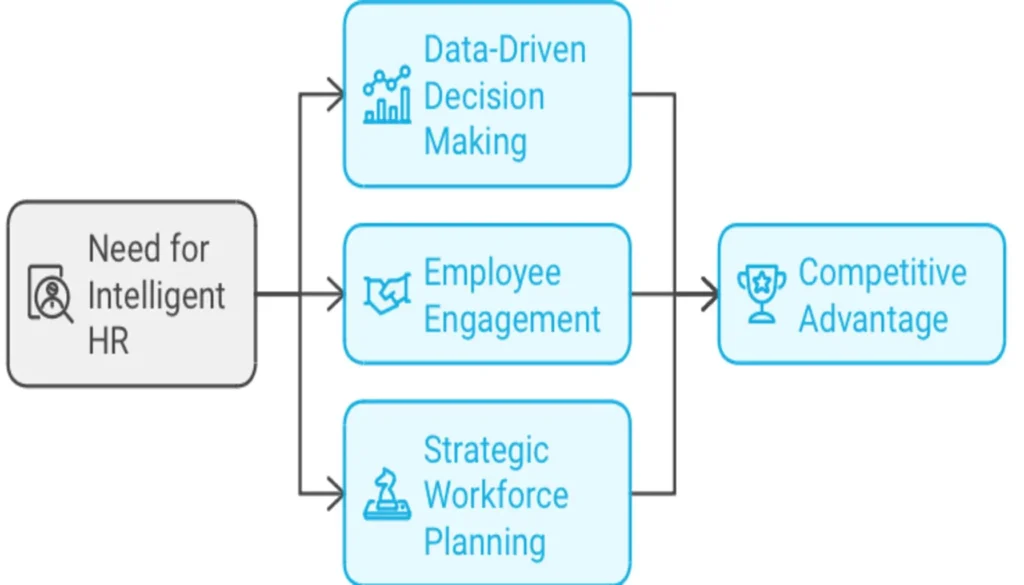
In today’s fast-paced business environment, intelligent HR practices are becoming increasingly crucial for organizations seeking to gain a competitive edge. But what exactly is intelligent HR, and how can organizations implement it effectively? Let’s dive deep into this transformative approach to human resource management.
Definition of Intelligent HR
Intelligent HR, also known as smart HR or AI-driven HR, refers to the use of advanced technologies, data analytics, and artificial intelligence to optimize HR processes, enhance decision-making, and drive organizational success. It involves leveraging data-driven insights to create more efficient, effective, and strategic HR practices that align with business objectives.
Key characteristics of intelligent HR include:
- Data-driven decision making
- Predictive analytics capabilities
- Automation of routine tasks
- Personalized employee experiences
- Continuous learning and adaptation
Key Strategies for Implementing Intelligent HR Practices
Implementing intelligent HR practices requires a strategic approach. Here are some key strategies to consider:
- Develop a Data-Centric Culture: Foster an organizational culture that values data-driven decision-making across all levels of HR and beyond.
- Invest in HR Technology: Implement advanced HR software and tools that can collect, analyze, and visualize HR data effectively. This might include AI-powered HRIS systems, predictive analytics platforms, or machine learning algorithms for talent management.
- Upskill HR Professionals: Provide training and development opportunities for HR staff to enhance their data analysis, interpretation, and technological skills. This might involve courses in data science, AI, or advanced analytics.
- Integrate HR Data Sources: Combine data from various HR systems and processes to gain a holistic view of the workforce. This might involve creating a centralized data warehouse or implementing data integration tools.
- Implement Predictive Analytics: Use advanced analytics techniques to predict future trends and make proactive HR decisions. This could include predicting employee turnover, identifying high-potential employees, or forecasting future skill needs.
- Leverage Artificial Intelligence: Explore AI-powered HR tools to automate routine tasks and uncover deeper insights from HR data. This might include chatbots for employee queries, AI-powered recruitment tools, or machine learning algorithms for performance management.
- Ensure Data Privacy and Security: Implement robust data protection measures to safeguard sensitive employee information. This is crucial for maintaining trust and compliance with data protection regulations.
- Focus on Employee Experience: Use intelligent HR practices to create personalized, engaging experiences for employees throughout their lifecycle with the organization.
Role of Data in Enhancing HR Intelligence
Data plays a pivotal role in enhancing HR intelligence. Here’s how:
- Informed Decision Making: Data provides empirical evidence to support HR decisions, reducing reliance on intuition or guesswork.
- Predictive Capabilities: By analyzing historical data, HR can predict future trends and outcomes, enabling proactive strategies.
- Performance Optimization: Data analytics can identify factors influencing employee performance, enabling targeted interventions.
- Personalization: Data insights allow for personalized employee experiences, from tailored learning programs to customized benefits packages.
- Process Improvement: Data analysis can reveal inefficiencies in HR processes, enabling continuous improvement.
- Strategic Alignment: HR data can demonstrate the impact of HR initiatives on business outcomes, ensuring alignment with organizational goals.
- Risk Management: Data analytics can help identify potential risks, from compliance issues to turnover risks, enabling proactive mitigation strategies.
Case Studies of Successful Intelligent HR Implementation
Let’s look at some real-world examples of organizations that have successfully implemented intelligent HR practices:
IBM’s AI-Powered Career Coach
IBM developed an AI-powered career coach called “Watson Career Coach” to provide personalized career advice to its employees. The system uses machine learning algorithms to analyze an employee’s skills, experience, and career aspirations, and provides tailored recommendations for career development.
Results:
- 96% of employees found the tool helpful for career planning
- 36% increase in employee retention among users of the tool
- Significant cost savings in career development programs
Unilever’s AI-Driven Recruitment Process
Unilever implemented an AI-driven recruitment process to streamline hiring for entry-level positions. The system uses games-based assessments, video interviews analyzed by AI, and predictive analytics to identify the best candidates.
Results:
- 75% reduction in time to hire
- 90% reduction in recruiter time spent on applications
- Significant increase in diversity of hires
- Cost savings of approximately £1 million annually
Hitachi’s AI-Powered Manager
Hitachi developed an AI-powered system to support managerial decision-making. The system analyzes vast amounts of data, including employee performance metrics, project outcomes, and even employee movement data from wearable devices, to provide recommendations for optimal team composition and work schedules.
Results:
- 15% increase in productivity in trial departments
- Improved employee satisfaction and engagement
- More data-driven and objective management decisions
These case studies demonstrate the transformative potential of intelligent HR practices. By leveraging data, AI, and advanced analytics, organizations can create more efficient, effective, and employee-centric HR functions that drive business success.
As we move forward in the era of intelligent HR, it’s clear that the role of HR professionals is evolving. Rather than being replaced by technology, HR professionals are being empowered by it, enabling them to focus on more strategic, value-adding activities that drive organizational success.
Link to a McKinsey article on the future of HR
Key HR Metrics Categories

In this section, we’ll explore six essential categories of HR metrics that every data-driven HR professional should be familiar with. We’ll dive into each category, discussing key metrics and how to leverage tools like Excel and Power BI for advanced analytics.
Recruitment Metrics
Recruitment metrics are crucial for evaluating the effectiveness and efficiency of your hiring processes. By tracking these metrics, you can identify bottlenecks, optimize your recruitment strategies, and ultimately attract top talent to your organization.
Key recruitment metrics include:
- Time to fill: The average number of days it takes to fill a vacant position.
- Cost per hire: The total cost associated with hiring a new employee.
- Quality of hire: A measure of how well a new hire performs in their role.
- Source of hire: The channels through which successful candidates are recruited.
Using Excel and Power BI for Recruitment Analytics
Excel and Power BI are powerful tools for analyzing recruitment data. Here’s how you can leverage them:
- Excel: Use pivot tables to analyze time to fill and cost per hire across different departments or job roles. Create charts to visualize trends in source of hire over time.
- Power BI: Build interactive dashboards that display real-time recruitment metrics. Create heat maps to identify which sources yield the highest quality hires.
Recruitment Source Analysis
This interactive dashboard provides a quick overview of recruitment sources, comparing the number of hires and their quality scores. It can help HR professionals identify which sources are most effective in terms of both quantity and quality of hires.
Learning & Development (L&D) Metrics
L&D metrics help organizations assess the effectiveness of their training programs and ensure that employees are developing the skills needed to drive business success.
Key L&D metrics include:
- Training completion rate: The percentage of employees who complete assigned training programs.
- Training effectiveness: A measure of how well employees apply newly learned skills on the job.
- Skills gap analysis: An assessment of the difference between the skills required for a role and the actual skills possessed by employees.
Measuring L&D ROI with Excel and Power BI
To measure the return on investment (ROI) of your L&D initiatives:
- Excel: Use built-in financial functions to calculate ROI based on training costs and estimated productivity gains. Create scatter plots to visualize the relationship between training hours and performance improvements.
- Power BI: Develop interactive reports that allow stakeholders to drill down into L&D metrics by department, job role, or training type. Use DAX measures to calculate complex KPIs like the impact of training on employee retention.

This flowchart illustrates the process of calculating and analyzing L&D ROI, from identifying costs to sharing insights with stakeholders.
Performance Management Metrics
Performance management metrics help organizations track employee productivity, goal achievement, and overall contribution to the company’s success.
Key performance management metrics include:
- Productivity metrics: Measures of output or value created per employee.
- Goal achievement rate: The percentage of employees meeting or exceeding their set objectives.
- Revenue per employee: Total revenue divided by the number of employees.
Using Excel for Performance Tracking and Analysis
Excel is a versatile tool for performance management:
- Create scorecards to track individual and team performance against KPIs.
- Use conditional formatting to highlight top performers and areas needing improvement.
- Develop macros to automate the collection and analysis of performance data from multiple sources.
Here’s an example of how you might structure a simple performance tracking spreadsheet in Excel:
| Employee | John Doe | Jane Smith | Bob Johnson |
| Department | Sales | Marketing | IT |
| Q1 Goals Achieved | 90% | 85% | 78% |
| Q2 Goals Achieved | 95% | 92% | 82% |
| Q3 Goals Achieved | 88% | 94% | 88% |
| Q4 Goals Achieved | 92% | 96% | 91% |
| Annual Achievement Rate | 91.25% | 91.75% | 84.75% |
By using Excel’s built-in features like conditional formatting and formulas, you can easily visualize performance trends and calculate overall achievement rates.
Employee Engagement Metrics
Employee engagement metrics provide insights into workforce satisfaction, motivation, and commitment to the organization.
Key employee engagement metrics include:
- Employee satisfaction score: A measure of overall employee contentment with their job and workplace.
- Employee Net Promoter Score (eNPS): An indicator of how likely employees are to recommend their organization as a place to work.
- Absenteeism rate: The frequency of unplanned absences in the workforce.
Analyzing Engagement Data with Power BI
Power BI offers advanced capabilities for analyzing and visualizing employee engagement data:
- Create heat maps to identify departments or teams with high or low engagement scores.
- Use natural language queries to explore engagement data interactively.
- Set up alerts to notify HR when engagement metrics fall below certain thresholds.
Employee Engagement Trends
This interactive chart visualizes trends in key engagement metrics over time, allowing HR professionals to identify patterns and potential correlations between satisfaction, eNPS, and absenteeism.
Retention Metrics
Retention metrics help organizations understand and improve their ability to retain valuable employees.
Key retention metrics include:
- Employee turnover rate: The percentage of employees who leave the organization over a specific period.
- Retention rate: The percentage of employees who remain with the organization over a specific period.
- Average tenure: The average length of time employees stay with the organization.
Predicting Turnover Using Excel Models
Excel can be used to create predictive models for employee turnover:
- Use logistic regression to identify factors that contribute to turnover.
- Create a retention risk score using weighted factors like performance, engagement, and time since last promotion.
- Develop what-if scenarios to test the potential impact of retention initiatives.
Link to SHRM article on using predictive analytics for employee retention
Diversity and Inclusion Metrics
Diversity and Inclusion (D&I) metrics help organizations track their progress in creating a more diverse and inclusive workplace.
Key D&I metrics include:
- Workforce diversity ratio: The proportion of employees from different demographic groups.
- Pay equity: A comparison of compensation across different demographic groups for similar roles.
- Inclusion index: A measure of how included and valued employees feel in the workplace.
Visualizing D&I Data with Power BI Dashboards
Power BI offers powerful visualization tools for D&I data:
- Create dynamic charts that show diversity ratios across different organizational levels.
- Use custom visuals like the decomposition tree to analyze pay equity across multiple dimensions.
- Develop interactive reports that allow users to explore D&I metrics by department, location, or job function.
Workforce Gender Diversity
This interactive pie chart provides a quick overview of gender diversity within the workforce. Similar visualizations can be created for other diversity dimensions, such as ethnicity, age, or disability status.
By tracking and analyzing these key HR metrics categories, organizations can gain valuable insights into their workforce, improve decision-making, and drive better business outcomes. The effective use of tools like Excel and Power BI can significantly enhance an organization’s ability to leverage these metrics for strategic HR management.
Implementing Data-Driven HR Management

Implementing a data-driven HR management approach is crucial for organizations looking to leverage the power of HR metrics and analytics. This section will explore the steps to establish a data-driven HR program, guide you in choosing the right HR metrics for your business, discuss data collection and analysis methods using Excel and Power BI, and address common challenges in data-driven HR.
Steps to Establish a Data-Driven HR Program
Creating a successful data-driven HR program requires careful planning and execution. Here’s a step-by-step guide to help you get started:
- Assess your current state: Evaluate your existing HR processes, data sources, and technology infrastructure.
- Define clear objectives: Align your data-driven HR goals with overall business objectives.
- Identify key stakeholders: Engage leadership, HR team members, and other relevant departments.
- Develop a data strategy: Determine what data you need, how to collect it, and how it will be used.
- Invest in technology: Choose appropriate HR analytics tools and platforms.
- Build data literacy: Train HR staff and other stakeholders in data analysis and interpretation.
- Implement data governance: Establish policies for data quality, security, and privacy.
- Start small and scale: Begin with pilot projects and expand as you gain experience and insights.
- Foster a data-driven culture: Encourage data-based decision-making across the organization.
- Continuously evaluate and improve: Regularly assess the effectiveness of your data-driven HR initiatives and refine as needed.
Choosing the Right HR Metrics for Your Business
Selecting the most relevant HR metrics is crucial for the success of your data-driven HR program. Here are some key considerations:
- Align with business objectives: Choose HR metrics that directly support your organization’s strategic goals.
- Focus on actionable insights: Prioritize metrics that can drive meaningful changes in HR practices.
- Consider industry benchmarks: Include metrics that allow for comparison with industry standards.
- Balance leading and lagging indicators: Combine predictive (leading) and historical (lagging) metrics for a comprehensive view.
- Ensure measurability: Select HR metrics that can be accurately and consistently measured over time.
Here’s a table of essential HR metrics across different functional areas:
| Functional Area | Key Metrics |
| Recruitment | Time-to-hire, Cost-per-hire, Quality of hire, Source of hire |
| Employee Engagement | Employee Net Promoter Score (eNPS), Turnover rate, Absenteeism rate |
| Performance Management | Goal achievement rate, Performance rating distribution, 360-degree feedback scores |
| Learning & Development | Training completion rate, Training ROI, Skills gap analysis |
| Compensation & Benefits | Compensation ratio, Benefits satisfaction rate, Pay equity |
| Workforce Planning | Headcount, Employee demographics, Succession pipeline strength |
Data Collection and Analysis Methods Using Excel and Power BI
Excel and Power BI are powerful tools for HR data collection, analysis, and visualization. Here’s how you can leverage these tools for data-driven HR:
Using Excel for HR Analytics
- Data collection: Create standardized templates for inputting HR data.
- Data cleaning: Use Excel functions to identify and correct data inconsistencies.
- Basic analysis: Utilize pivot tables and charts for initial data exploration.
- Statistical analysis: Perform correlation analyses and regression models using Excel’s Data Analysis ToolPak.
- Reporting: Create dynamic dashboards using Excel’s advanced features like Power Pivot and Power Query.
Link to Microsoft’s Excel for HR professionals course
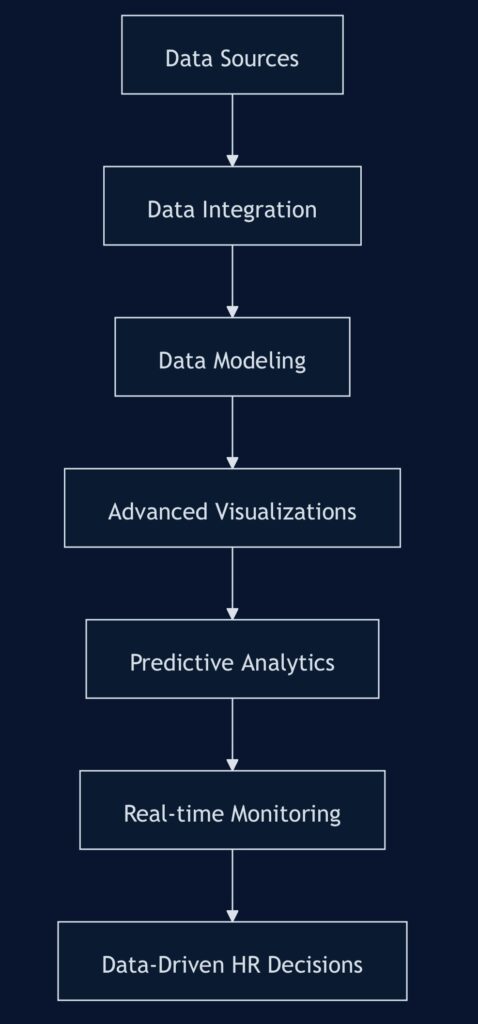
Leveraging Power BI for HR Insights
- Data integration: Connect Power BI to various HR data sources (HRIS, ATS, performance management systems).
- Data modeling: Create relationships between different data sets for comprehensive analysis.
- Advanced visualizations: Develop interactive dashboards and reports with Power BI’s rich visualization options.
- Predictive analytics: Utilize Power BI’s machine learning capabilities for workforce forecasting and trend analysis.
- Real-time monitoring: Set up Power BI to provide real-time updates on key HR metrics.
Overcoming Challenges in Data-Driven HR
While implementing data-driven HR practices, organizations may face several challenges. Here are some common obstacles and strategies to overcome them:
- Data quality issues:
- Solution: Implement data validation processes and regular data audits.
- Lack of analytical skills in HR teams:
- Solution: Provide training programs in data analysis and interpretation or consider hiring HR analysts.
- Resistance to change:
- Solution: Communicate the benefits of data-driven HR and involve stakeholders in the process.
- Data privacy concerns:
- Solution: Develop robust data governance policies and ensure compliance with data protection regulations.
- Integration of multiple data sources:
- Solution: Invest in HR analytics platforms that can integrate data from various HR systems.
- Difficulty in measuring intangible factors:
- Solution: Develop proxy metrics and combine quantitative data with qualitative insights.
- Overreliance on metrics:
- Solution: Balance data-driven decisions with human judgment and contextual understanding.
By addressing these challenges proactively, organizations can successfully implement data-driven HR management practices and reap the benefits of HR analytics.
Technology Trends & Practices in HR

In recent years, the HR landscape has been dramatically transformed by technological advancements. These innovations have revolutionized how HR professionals collect, analyze, and leverage data to make informed decisions. Let’s explore the current technology trends influencing HR practices and their implications for the future of work.
Current Technology Trends Influencing HR Practices
- Cloud-based HR Systems: Cloud technology has enabled HR departments to access and manage employee data from anywhere, facilitating remote work and improving efficiency.
- Artificial Intelligence (AI) and Machine Learning (ML): AI and ML are being used to automate routine tasks, predict employee behavior, and provide personalized employee experiences.
- Internet of Things (IoT): IoT devices are being used to track employee productivity, monitor workplace safety, and optimize office spaces.
- Blockchain: This technology is being explored for secure storage of employee records and verification of credentials.
- Virtual and Augmented Reality (VR/AR): VR and AR are being used for immersive employee training experiences and remote collaboration.
- Chatbots and Natural Language Processing (NLP): AI-powered chatbots are being used to handle employee queries and streamline HR processes.
- Data Visualization Tools: Advanced data visualization tools are helping HR professionals present complex data in easily understandable formats.

The Role of Excel and Power BI in Modern HR
While there are many advanced HR analytics tools available, Microsoft Excel and Power BI continue to play crucial roles in modern HR practices due to their accessibility, versatility, and powerful data analysis capabilities.
Excel in HR Analytics
- Data Collection and Storage: Excel’s familiar interface makes it easy for HR professionals to input, store, and organize large amounts of employee data.
- Basic Data Analysis: Excel’s built-in functions and formulas allow for quick calculations of key HR metrics.
- Data Visualization: Charts and graphs in Excel provide a straightforward way to visualize HR data.
- Ad-hoc Reporting: Excel’s flexibility makes it ideal for creating customized reports on the fly.
Power BI in HR Analytics
- Advanced Data Visualization: Power BI offers more sophisticated and interactive visualizations compared to Excel.
- Data Integration: Power BI can connect to multiple data sources, providing a holistic view of HR data.
- Real-time Dashboards: Power BI allows for the creation of dynamic dashboards that update in real-time.
- Predictive Analytics: With its integration with R and Python, Power BI can perform advanced predictive analytics.
Here’s a comparison table of Excel and Power BI for HR analytics:
| Feature | Excel | Power BI |
| Data Input | ⭐⭐⭐⭐⭐ | ⭐⭐⭐ |
| Basic Analysis | ⭐⭐⭐⭐⭐ | ⭐⭐⭐⭐ |
| Advanced Analysis | ⭐⭐⭐ | ⭐⭐⭐⭐⭐ |
| Data Visualization | ⭐⭐⭐ | ⭐⭐⭐⭐⭐ |
| Real-time Updates | ⭐⭐ | ⭐⭐⭐⭐⭐ |
| Data Integration | ⭐⭐ | ⭐⭐⭐⭐⭐ |
| Ease of Use | ⭐⭐⭐⭐⭐ | ⭐⭐⭐ |
AI and Machine Learning in HR Analytics
Artificial Intelligence and Machine Learning are revolutionizing HR analytics by enabling more sophisticated data analysis and prediction. Here are some key applications:
- Predictive Analytics: AI can forecast employee turnover, identify high-potential employees, and predict future skill requirements.
- Sentiment Analysis: ML algorithms can analyze employee feedback and communication to gauge overall employee sentiment and engagement.
- Chatbots for Employee Support: AI-powered chatbots can handle routine HR queries, freeing up HR professionals for more strategic tasks.
- Resume Screening and Candidate Matching: AI can quickly scan resumes and match candidates to job requirements, streamlining the recruitment process.
- Personalized Learning and Development: ML algorithms can recommend personalized learning paths based on an employee’s skills, goals, and performance.
- Performance Management: AI can provide more objective and data-driven performance evaluations by analyzing multiple data points.
- Workforce Planning: AI can analyze historical data and external factors to predict future workforce needs and skills gaps.
Future Predictions for HR Technology
As we look towards the future, several emerging trends are likely to shape HR technology:
- Increased Use of Big Data: HR departments will leverage big data analytics to gain deeper insights into workforce trends and make more informed decisions.
- Enhanced Employee Experience Platforms: Integrated platforms will provide personalized, consumer-grade experiences for employees throughout their lifecycle.
- Adoption of Blockchain for HR: Blockchain technology will be increasingly used for secure storage and verification of employee credentials and work history.
- Virtual Reality for Training and Onboarding: VR will become more prevalent in creating immersive training experiences and virtual onboarding processes.
- Wearable Technology for Employee Wellness: Wearable devices will be used to monitor employee health and stress levels, supporting wellness initiatives.
- Advanced Predictive Analytics: HR analytics will become more sophisticated, using AI to predict and prevent potential HR issues before they occur.
- Ethical AI and Data Privacy: There will be an increased focus on developing ethical AI systems and ensuring data privacy in HR technology.
As HR continues to evolve, staying abreast of these technology trends will be crucial for HR professionals looking to create intelligent, data-driven HR systems. By leveraging these technologies effectively, HR can play a more strategic role in driving organizational success.
Link to Deloitte’s 2023 Global Human Capital Trends report
Data-Driven HR Tools
In the era of data-driven HR, leveraging the right tools is crucial for extracting meaningful insights from HR metrics and making informed decisions. This section explores various data-driven HR tools, their integration into existing processes, and the advantages of using popular platforms like Excel and Power BI for HR analytics.
Overview of Effective Data-Driven HR Tools
Data-driven HR tools encompass a wide range of software and platforms designed to collect, analyze, and visualize HR data. Here are some of the most effective tools used in modern HR departments:
- Human Resource Information Systems (HRIS): Centralized platforms for managing employee data, payroll, and benefits.
- Applicant Tracking Systems (ATS): Tools for managing the recruitment process and analyzing hiring metrics.
- Learning Management Systems (LMS): Platforms for delivering and tracking employee training and development.
- Performance Management Software: Tools for setting goals, tracking performance, and conducting reviews.
- Employee Engagement Platforms: Systems for measuring and analyzing employee satisfaction and engagement.
- HR Analytics Dashboards: Visual interfaces for displaying key HR metrics and KPIs.
- Workforce Planning Tools: Software for forecasting talent needs and optimizing workforce allocation.

Integrating Tools into Existing HR Processes
Implementing data-driven HR tools requires careful planning and integration with existing processes. Here are some best practices for seamlessly incorporating these tools:
- Assess current processes: Evaluate existing HR workflows to identify areas where data-driven tools can add value.
- Define clear objectives: Establish specific goals for implementing each tool, aligned with overall HR and business objectives.
- Ensure data compatibility: Verify that new tools can integrate with existing systems and data formats to prevent silos.
- Provide comprehensive training: Offer thorough training to HR staff and other users to ensure effective tool utilization.
- Start with pilot programs: Implement tools in phases, starting with small-scale pilot programs to test effectiveness and gather feedback.
- Regularly review and optimize: Continuously assess the impact of implemented tools and refine their usage based on insights gained.
- Foster a data-driven culture: Encourage the use of data-driven insights across all HR functions and decision-making processes.
Advantages of Using Excel and Power BI for HR Analytics
While there are many specialized HR analytics tools available, Microsoft Excel and Power BI remain popular choices due to their versatility and widespread availability. Here are some key advantages of using these tools for HR analytics:
Excel for HR Analytics
- Widely available and familiar to many HR professionals
- Powerful data manipulation and analysis capabilities
- Extensive library of built-in functions for statistical analysis
- Ability to create custom formulas and macros for specific HR calculations
- Easy-to-use charting and visualization features
Power BI for HR Analytics
- Advanced data visualization capabilities
- Real-time data updates and interactive dashboards
- Ability to connect to multiple data sources
- Powerful data modeling and relationship mapping features
- Collaborative features for sharing insights across teams
Link to Microsoft’s guide on using Power BI for HR analytics
Comparison of Popular HR Data Tools and Their Benefits
To help you choose the right tools for your organization, here’s a comparison of some popular HR data tools and their key benefits:
| Tool | Primary Function | Key Benefits |
| Workday | HRIS | – Unified system for HR, finance, and planning – Strong analytics and reporting capabilities – Cloud-based for easy access |
| SAP SuccessFactors | HRIS & Talent Management | – Comprehensive suite of HR tools – Strong learning and development features – Robust workforce analytics |
| Tableau | Data Visualization | – Powerful data visualization capabilities – Easy integration with multiple data sources – User-friendly interface for creating dashboards |
| Visier | HR Analytics | – Specialized HR analytics platform – Pre-built analytics and benchmarking – Predictive analytics capabilities |
| BambooHR | HRIS for Small-Medium Businesses | – User-friendly interface – Comprehensive employee database – Strong applicant tracking system |
Benefits of HR Data Tools
- Improved Decision-Making (30%)
- Enhanced Efficiency (25%)
- Better Data Visualization (20%)
- Predictive Analytics (15%)
- Streamlined Processes (10%)
When selecting HR data tools, consider factors such as:
- Your organization’s size and specific needs
- Integration capabilities with existing systems
- Scalability for future growth
- User-friendliness and required training
- Cost and return on investment (ROI)
By carefully selecting and implementing the right data-driven HR tools, organizations can significantly enhance their ability to leverage HR metrics and analytics, leading to more informed decision-making and improved overall HR effectiveness.
Using HR Metrics for Strategic Decision Making

In the modern business landscape, HR metrics have evolved from mere operational measurements to powerful tools for strategic decision-making. By leveraging data effectively, HR professionals can drive organizational success and demonstrate the tangible value of HR initiatives. Let’s explore how to use HR metrics strategically, with a focus on aligning metrics with business goals, utilizing predictive analytics, improving workforce planning, and examining real-world success stories.
Aligning HR Metrics with Business Goals
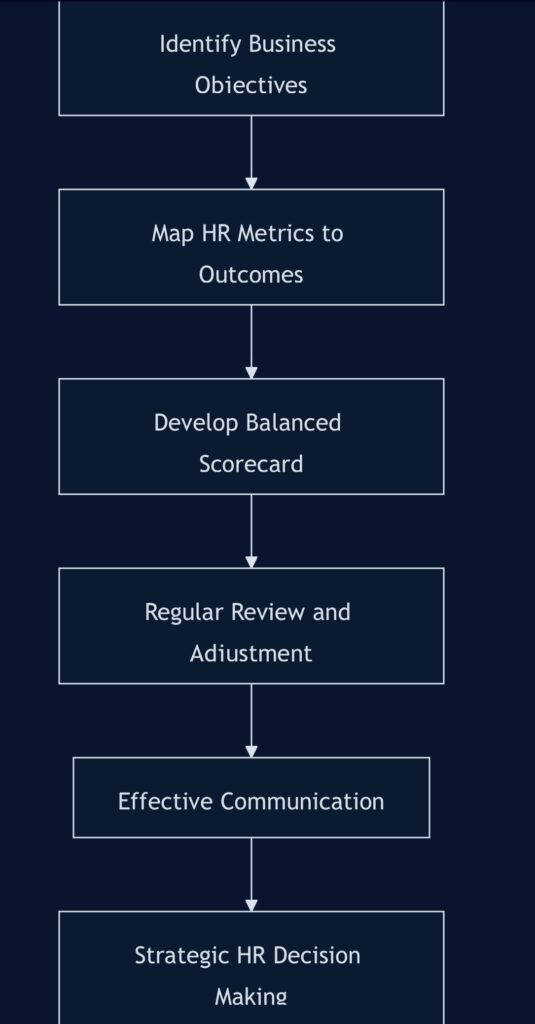
To maximize the impact of HR metrics, it’s crucial to align them with your organization’s overarching business objectives. This alignment ensures that HR efforts contribute directly to the company’s success. Here’s how to achieve this alignment:
- Identify key business objectives: Work closely with executive leadership to understand the organization’s primary goals and challenges.
- Map HR metrics to business outcomes: Determine which HR metrics can best indicate progress towards these objectives.
- Develop a balanced scorecard: Create a comprehensive view of HR’s impact by including metrics that cover multiple aspects of the business.
- Regularly review and adjust: As business goals evolve, continually reassess and update your HR metrics to maintain alignment.
- Communicate effectively: Present HR metrics in a way that clearly demonstrates their connection to business outcomes.
Predictive Analytics in HR Using Excel and Power BI
Predictive analytics is a powerful tool that allows HR professionals to forecast future trends and make proactive decisions. Both Excel and Power BI offer robust capabilities for implementing predictive analytics in HR:
Using Excel for Predictive Analytics
- Trend Analysis: Use Excel’s trendline feature to project future values based on historical data.
- Regression Analysis: Utilize Excel’s Data Analysis ToolPak for more advanced predictive modeling.
- What-If Analysis: Employ Excel’s Scenario Manager and Goal Seek functions to model different outcomes.
Leveraging Power BI for HR Predictions
- Advanced Visualizations: Create interactive dashboards that allow for real-time data exploration.
- Time Series Forecasting: Use Power BI’s built-in forecasting feature to predict future trends.
- Machine Learning Integration: Connect Power BI to Azure Machine Learning for more sophisticated predictive models.
Here’s a simple example of how you might use Excel to predict future employee turnover based on historical data:
| Year | Turnover Rate | Predicted Turnover Rate |
| 2018 | 12% | – |
| 2019 | 10% | – |
| 2020 | 15% | – |
| 2021 | 13% | – |
| 2022 | 11% | – |
| 2023 | – | 12.5% |
| 2024 | – | 12.3% |
In this example, we’ve used Excel’s FORECAST function to predict turnover rates for 2023 and 2024 based on the historical data from 2018-2022.
Link to Microsoft’s guide on using Excel for forecasting
Using Metrics to Improve Workforce Planning
Effective workforce planning is critical for ensuring that an organization has the right talent in place to meet its current and future needs. HR metrics play a vital role in this process:
- Headcount Forecasting: Use historical data and growth projections to predict future staffing needs.
- Skills Gap Analysis: Identify areas where the current workforce lacks skills needed for future success.
- Succession Planning: Use performance metrics and potential assessments to identify and develop future leaders.
- Retention Risk Assessment: Analyze turnover patterns to predict and mitigate potential talent losses.
- Recruitment Channel Effectiveness: Evaluate the quality and quantity of hires from different sources to optimize recruitment strategies.
Case Studies: Success Stories of Data-Driven HR
Let’s examine two real-world examples of organizations that have successfully leveraged HR metrics for strategic decision-making:
Case Study 1: Tech Giant’s Predictive Attrition Model
A leading technology company developed a predictive model using HR metrics to identify employees at risk of leaving. The model considered factors such as performance ratings, time since last promotion, and engagement survey scores. By proactively addressing the needs of at-risk employees, the company reduced voluntary turnover by 20% within one year, resulting in significant cost savings and improved employee satisfaction.
Case Study 2: Retail Chain’s Data-Driven Recruitment Strategy
A large retail chain used HR analytics to optimize its recruitment process. By analyzing the performance and tenure of employees hired through different channels, they identified that employee referrals led to higher-quality hires with longer tenures. This insight led them to invest more in their employee referral program, resulting in a 15% increase in high-quality hires and a 10% reduction in time-to-fill for key positions.
These case studies demonstrate the tangible benefits of using HR metrics for strategic decision-making. By leveraging data effectively, organizations can improve their workforce planning, reduce costs, and drive better business outcomes.
In conclusion, using HR metrics for strategic decision-making is no longer a luxury but a necessity in today’s data-driven business environment. By aligning metrics with business goals, leveraging predictive analytics, improving workforce planning, and learning from success stories, HR professionals can position themselves as strategic partners in driving organizational success.
Best Practices for HR metrics and Analytics

As organizations increasingly rely on data-driven decision-making in HR, it’s crucial to implement best practices that ensure the effectiveness, reliability, and ethical use of HR analytics. This section will explore key considerations and strategies for optimizing your HR analytics processes.
Ensuring Data Quality and Accuracy
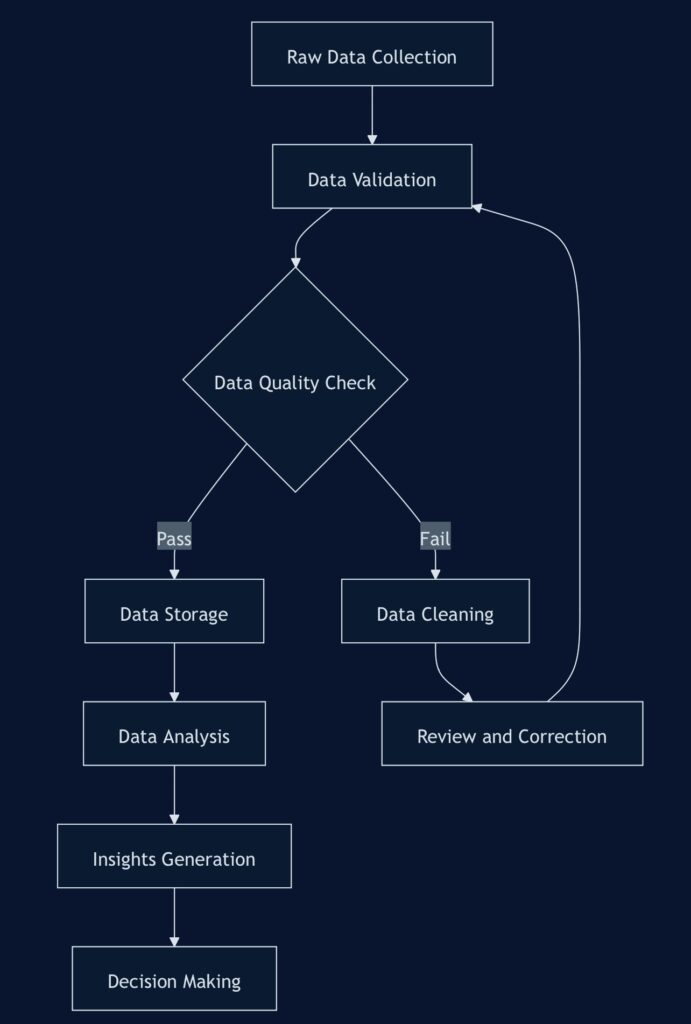
The foundation of effective HR analytics lies in the quality and accuracy of the data being analyzed. Here are some best practices to maintain high data standards:
- Implement data governance policies: Establish clear guidelines for data collection, storage, and usage across the organization.
- Standardize data collection methods: Ensure consistency in how data is gathered across different departments and systems.
- Regularly audit data: Conduct periodic checks to identify and correct errors, inconsistencies, or outdated information.
- Use data validation tools: Implement automated tools to check for data accuracy and flag potential issues.
- Train employees on data entry: Provide comprehensive training to all staff involved in data input to minimize errors.
- Establish data cleaning processes: Develop systematic procedures for cleaning and preprocessing data before analysis.
- Document data sources and transformations: Maintain clear records of where data comes from and how it’s been modified.
- Implement version control: Use version control systems to track changes in data sets and analytics models over time.
Privacy and Ethical Considerations in HR Data
As HR analytics often involves sensitive employee information, it’s crucial to address privacy concerns and ethical considerations:
- Comply with data protection regulations: Ensure adherence to relevant laws such as GDPR, CCPA, or local data protection regulations.
- Implement robust data security measures: Use encryption, access controls, and secure storage solutions to protect HR data.
- Obtain informed consent: Clearly communicate to employees what data is being collected and how it will be used.
- Anonymize data when possible: Remove personally identifiable information when conducting analyses that don’t require individual-level data.
- Establish ethical guidelines: Develop a code of ethics for HR analytics that addresses issues such as fairness, transparency, and non-discrimination.
- Conduct regular privacy impact assessments: Evaluate the potential privacy risks associated with new HR analytics initiatives.
- Provide data access and correction options: Allow employees to view and correct their personal data when appropriate.
- Train HR professionals on data ethics: Ensure that all staff handling HR data understand the ethical implications of their work.
Creating Effective HR Dashboards with Power BI
Power BI is a powerful tool for creating interactive and visually appealing HR dashboards. Here are some best practices for designing effective HR dashboards:
- Define clear objectives: Determine the specific goals and key performance indicators (KPIs) that the dashboard will track.
- Choose appropriate visualizations: Select chart types and visualizations that best represent your data and make insights easily digestible.
- Implement a logical layout: Organize dashboard elements in a way that tells a coherent story and guides users through the data.
- Use consistent design elements: Maintain a uniform color scheme, font, and styling throughout the dashboard for a professional look.
- Incorporate interactivity: Utilize Power BI’s features like slicers, drill-downs, and tooltips to allow users to explore data dynamically.
- Optimize for performance: Ensure that the dashboard loads quickly by optimizing data models and using appropriate aggregations.
- Provide context: Include benchmarks, targets, or historical data to give meaning to the metrics displayed.
- Regularly update and maintain: Keep the dashboard current by automating data refreshes and periodically reviewing its relevance.
HR Metrics Dashboard
Continuous Improvement in HR Analytics Processes
To maintain the effectiveness of your HR analytics efforts, it’s essential to adopt a mindset of continuous improvement:
- Regularly review metrics and KPIs: Assess the relevance and usefulness of your HR metrics periodically and adjust as needed.
- Seek feedback from stakeholders: Gather input from HR professionals, managers, and executives on the value and usability of analytics outputs.
- Stay updated on industry trends: Keep abreast of new developments in HR analytics, including emerging technologies and methodologies.
- Invest in ongoing training: Provide continuous learning opportunities for HR staff to enhance their analytics skills and knowledge.
- Conduct post-implementation reviews: After implementing new analytics initiatives, evaluate their impact and identify areas for improvement.
- Benchmark against industry standards: Compare your HR analytics practices with those of industry leaders to identify improvement opportunities.
- Encourage experimentation: Foster a culture that supports testing new analytics approaches and learning from both successes and failures.
- Integrate analytics into decision-making processes: Ensure that insights from HR analytics are consistently used to inform strategic decisions.
By following these best practices, organizations can build robust, ethical, and effective HR analytics processes that drive continuous improvement and support data-driven decision-making in HR.
Future of HR Metrics & Analytics

As we navigate the ever-evolving landscape of work, HR metrics and analytics continue to play an increasingly crucial role in shaping organizational success. This section explores the future of HR metrics and analytics, highlighting emerging trends, technologies, and practices that will define data-driven HR in the years to come.
Emerging HR Metrics for the Future of Work
The future of work brings new challenges and opportunities, necessitating the development of innovative HR metrics to measure and manage workforce dynamics effectively. Here are some emerging HR metrics that organizations should consider incorporating into their analytics toolkit:
- Remote Work Productivity Index: A composite metric that measures employee productivity, engagement, and well-being in remote or hybrid work environments.
- Digital Dexterity Score: Assesses employees’ ability to adapt to and leverage new technologies in their roles.
- Talent Ecosystem Health: Measures the strength and diversity of an organization’s extended workforce, including full-time employees, contractors, and gig workers.
- Innovation Potential Metric: Evaluates an employee’s or team’s capacity to generate and implement innovative ideas.
- Cultural Alignment Score: Gauges how well employees’ values and behaviors align with the organization’s culture and values.
- Workforce Agility Index: Measures the organization’s ability to quickly redeploy talent in response to changing business needs.
- Employee Wellbeing Quotient: A holistic metric that combines physical, mental, and financial wellbeing indicators.
- Skill Adjacency Rate: Tracks how quickly employees can acquire adjacent skills to adapt to evolving job requirements.
Real-time HR Metrics and Dashboards
The future of HR analytics lies in real-time data processing and visualization. Real-time HR metrics and dashboards offer several advantages:
- Immediate insights: Access up-to-the-minute data on key HR metrics, enabling quick decision-making.
- Proactive issue resolution: Identify and address potential problems before they escalate.
- Agile workforce management: Respond rapidly to changing business needs by reallocating resources in real-time.
- Enhanced employee experience: Provide timely feedback and support based on real-time performance and engagement data.
- Improved compliance: Monitor and ensure compliance with labor laws and regulations in real-time.
To implement real-time HR metrics and dashboards effectively, consider the following best practices:
- Invest in robust HR analytics platforms that support real-time data processing and visualization.
- Prioritize the most critical metrics for real-time tracking to avoid information overload.
- Ensure data accuracy and reliability through automated data validation processes.
- Provide training to HR professionals and managers on interpreting and acting on real-time data.
- Establish clear protocols for responding to real-time alerts and anomalies.
The Impact of Big Data on HR Practices
Big data is revolutionizing HR practices, offering unprecedented opportunities for in-depth analysis and predictive modeling. Here’s how big data is shaping the future of HR:
- Predictive Analytics: Leverage large datasets to forecast future talent needs, employee turnover, and performance trends.
- Enhanced Recruitment: Use big data to identify the most effective sourcing channels and predict candidate success.
- Personalized Employee Experience: Tailor employee development programs and benefits based on individual preferences and needs.
- Advanced Performance Management: Utilize comprehensive data sets to provide more accurate and nuanced performance evaluations.
- Workforce Planning: Make data-driven decisions about workforce composition, skills development, and succession planning.
- Diversity and Inclusion: Analyze large-scale data to identify and address systemic biases in HR processes.
- Employee Sentiment Analysis: Use natural language processing to analyze employee feedback and gauge sentiment across the organization.
Preparing for the Future of Data-Driven HR
To stay ahead in the rapidly evolving field of HR metrics and analytics, organizations and HR professionals should focus on the following areas:
- Continuous learning: Stay updated on the latest trends in HR analytics, data science, and emerging technologies.
- Ethical data use: Develop robust data governance frameworks to ensure ethical use of employee data and maintain trust.
- Cross-functional collaboration: Foster partnerships between HR, IT, and data science teams to drive innovation in HR analytics.
- Data literacy: Invest in training programs to improve data literacy across the organization, particularly among HR professionals and managers.
- Agile HR systems: Implement flexible HR technologies that can adapt to changing data needs and integrate with other business systems.
- AI and machine learning: Explore the potential of AI and machine learning in automating HR processes and uncovering deeper insights.
- Data storytelling: Develop skills in translating complex data insights into compelling narratives that drive action.
By embracing these emerging trends and preparing for the future of data-driven HR, organizations can position themselves to thrive in the ever-changing world of work. The key lies in remaining agile, ethical, and innovative in the application of HR metrics and analytics.
Conclusion
As we wrap up our comprehensive exploration of HR metrics and analytics, it’s clear that data-driven approaches are not just a passing trend, but a fundamental shift in how HR operates and contributes to organizational success. Let’s recap the key points and look towards the future of HR analytics.
Recap of the Importance of HR Metrics and Analytics
Throughout this guide, we’ve seen how HR metrics and analytics can:
- Transform decision-making processes
- Enhance operational efficiency
- Align HR strategies with business objectives
- Demonstrate the tangible value of HR initiatives
- Improve employee engagement and retention
- Optimize recruitment and talent acquisition
- Drive performance management and learning & development
- Foster a data-driven culture within organizations
These benefits underscore the critical role that HR metrics and analytics play in modern, forward-thinking organizations. By embracing these tools and methodologies, HR professionals can elevate their strategic impact and drive meaningful business outcomes.
Summary of Excel and Power BI’s Role in HR Data Management
Excel and Power BI have emerged as powerful allies in the HR professional’s toolkit:
Excel continues to be a versatile and accessible tool for HR professionals, offering:
- Familiar interface for data entry and basic analysis
- Powerful formulas and pivot tables for data manipulation
- Wide adoption across organizations
- Flexibility in creating custom reports and dashboards
Power BI takes HR analytics to the next level by providing:
- Advanced data visualization capabilities
- Real-time data updates and interactive dashboards
- Robust data integration from multiple sources
- Predictive analytics and AI-powered insights
- Enhanced collaboration and sharing features
By leveraging both tools, HR professionals can create a comprehensive data management ecosystem that caters to various analytical needs and skill levels within the organization.
Final Thoughts on the Future of HR Analytics
As we look to the future, several trends are shaping the evolution of HR analytics:
- AI and Machine Learning: Advanced algorithms will enable more sophisticated predictive analytics and personalized HR interventions.
- Natural Language Processing: NLP will make HR analytics more accessible, allowing users to interact with data using conversational queries.
- Continuous Performance Management: Real-time analytics will support ongoing performance feedback and development.
- People Analytics Platforms: Integrated solutions will emerge, offering end-to-end HR analytics capabilities.
- Ethics and Privacy: As data collection becomes more pervasive, ethical considerations and data privacy will be at the forefront of HR analytics discussions.
- Skills Gap Analysis: Analytics will play a crucial role in identifying and addressing skills gaps in the workforce.
- Employee Experience Analytics: More emphasis will be placed on measuring and optimizing the entire employee lifecycle.
As we conclude this guide, it’s clear that the future of HR lies in data-driven decision-making. Here’s a call to action for HR professionals looking to embrace this future:
- Invest in your analytics skills: Take courses in data analysis, statistics, and HR analytics tools like Excel and Power BI.
- Start small, think big: Begin with a few key metrics and gradually expand your analytics capabilities.
- Collaborate across departments: Partner with IT, finance, and other data-savvy teams to enhance your analytics initiatives.
- Stay informed: Keep up with the latest trends and best practices in HR analytics through industry publications and conferences.
- Champion data-driven culture: Advocate for the importance of data-driven decision-making within your organization.
- Prioritize data quality: Implement robust data collection and management processes to ensure the accuracy of your analytics.
- Focus on actionable insights: Always tie your analytics efforts to concrete actions and business outcomes.
By embracing HR metrics and analytics, you’re not just improving your HR processes – you’re positioning yourself and your organization for success in an increasingly data-driven world.
Remember, the journey to becoming a data-driven HR professional is ongoing. Stay curious, keep learning, and don’t be afraid to experiment with new tools and techniques. The future of HR is data-driven, and by embracing this shift, you’ll be at the forefront of shaping that future.
FAQs about HR Metrics & Analytics
In this section, we’ll address some of the most common questions about HR metrics and analytics. These insights will help you navigate the complexities of data-driven HR practices and implement them effectively in your organization.
What’s the difference between HR metrics and HR analytics?
HR metrics and HR analytics are closely related but distinct concepts:
- HR metrics are specific measurements used to quantify various aspects of HR processes and outcomes. They provide a snapshot of HR performance at a given time.
- HR analytics involves the analysis and interpretation of HR metrics and other data to uncover insights, identify trends, and make predictions. It’s a more comprehensive approach that uses metrics as inputs for deeper analysis.
How can small businesses benefit from HR metrics and analytics?
Small businesses can gain significant advantages from implementing HR metrics and analytics:
- Cost-effective decision-making: Data-driven insights help allocate limited resources more efficiently.
- Improved hiring processes: Analyze recruitment metrics to optimize hiring strategies and reduce turnover.
- Enhanced employee engagement: Track engagement metrics to identify and address issues early.
- Competitive advantage: Use data to make strategic HR decisions that larger competitors might overlook.
- Scalability: Establish data-driven processes early to support growth as the business expands.
What are the essential Excel skills needed for HR analytics?
To effectively use Excel for HR analytics, professionals should be proficient in:
- Data entry and organization
- Formulas and functions (e.g., VLOOKUP, IF, SUMIF)
- Pivot tables and charts
- Data visualization techniques
- Statistical analysis (e.g., regression, correlation)
- Data cleaning and validation
- Macro creation for automation
- Power Query for data transformation
- Power Pivot for advanced data modeling
- Dashboard creation
How often should we measure and update our HR metrics?
The frequency of measuring and updating HR metrics depends on various factors:
- Real-time metrics: Some metrics, like employee attendance or productivity, may be tracked daily or weekly.
- Monthly metrics: Recruitment metrics, turnover rates, and training completion rates are often updated monthly.
- Quarterly metrics: Employee engagement, performance metrics, and financial HR metrics are typically reviewed quarterly.
- Annual metrics: Comprehensive workforce analytics and long-term trend analyses are usually conducted annually.
Best practice: Establish a regular cadence for each metric based on its importance and volatility, ensuring that the data remains relevant and actionable.
Can Power BI integrate with other HR software systems?
Yes, Power BI offers robust integration capabilities with various HR software systems:
- HRIS Integration: Connect directly to popular HRIS platforms like Workday, SAP SuccessFactors, and Oracle HCM.
- ATS Integration: Import data from Applicant Tracking Systems like Greenhouse, Lever, or Taleo.
- Custom Connectors: Develop custom connectors for proprietary or niche HR systems.
- API Connections: Utilize APIs to connect with cloud-based HR tools and services.
- Database Integration: Connect to SQL databases, Excel files, and other data sources used by HR systems.
What are some common pitfalls when implementing HR analytics?
When implementing HR analytics, be aware of these potential pitfalls:
- Focusing on quantity over quality: Tracking too many metrics without clear objectives.
- Neglecting data quality: Failing to ensure data accuracy and consistency.
- Lack of context: Interpreting metrics without considering broader organizational factors.
- Insufficient stakeholder buy-in: Failing to get leadership support for data-driven HR initiatives.
- Inadequate skills: Not investing in upskilling HR teams in data analysis and interpretation.
- Ignoring data privacy: Overlooking legal and ethical considerations in data collection and use.
- Siloed approach: Failing to integrate HR data with other business data for comprehensive insights.
- Analysis paralysis: Over-analyzing data without taking action on insights.
- Neglecting change management: Failing to prepare the organization for data-driven cultural shifts.
- Overlooking data storytelling: Presenting data without clear narratives and actionable recommendations.
How can we ensure data privacy when using HR analytics tools?
Ensuring data privacy in HR analytics is crucial. Consider these strategies:
- Implement robust access controls: Limit data access based on roles and responsibilities.
- Use data anonymization techniques: Remove or encrypt personally identifiable information when possible.
- Conduct regular security audits: Assess and update security measures for HR analytics tools.
- Provide data privacy training: Educate HR staff on data protection best practices.
- Develop clear data governance policies: Establish guidelines for data collection, storage, and use.
- Obtain employee consent: Be transparent about data collection and use, obtaining consent when necessary.
- Comply with regulations: Ensure adherence to data protection laws like GDPR, CCPA, etc.
- Use secure cloud storage: Choose reputable providers with strong security measures.
- Implement data encryption: Protect sensitive HR data both in transit and at rest.
- Regularly update and patch systems: Keep HR analytics tools and systems up-to-date to address security vulnerabilities.
What are the best practices for presenting HR metrics to leadership?
When presenting HR metrics to leadership, consider these best practices:
- Align with business objectives: Connect HR metrics to overall organizational goals.
- Focus on key insights: Present the most impactful metrics rather than overwhelming with data.
- Use clear visualizations: Employ charts, graphs, and dashboards for easy comprehension.
- Provide context: Compare metrics to industry benchmarks or historical data.
- Tell a story: Use data to craft a compelling narrative about workforce trends and challenges.
- Offer actionable recommendations: Suggest concrete steps based on the insights presented.
- Be prepared for questions: Anticipate potential inquiries and have supporting data ready.
- Use a mix of leading and lagging indicators: Balance predictive and historical metrics.
- Highlight ROI: Demonstrate the financial impact of HR initiatives where possible.
- Update regularly: Establish a cadence for reporting that keeps leadership informed without overwhelming them.
How can we use Excel to predict future HR trends?
Excel offers several tools for predicting future HR trends:
- Trend analysis: Use trendlines in charts to project future values based on historical data.
- Forecasting functions: Utilize FORECAST, TREND, or GROWTH functions for time-series predictions.
- Regression analysis: Apply linear or multiple regression to identify relationships between variables.
- What-if analysis: Use Goal Seek or Scenario Manager to model different future scenarios.
- Monte Carlo simulation: Create complex models to simulate various outcomes and probabilities.
- Power Query: Clean and transform large datasets for more accurate predictions.
- Power Pivot: Build sophisticated data models for advanced trend analysis.
- Pivot tables and charts: Quickly analyze and visualize trends across multiple dimensions.
- Conditional formatting: Highlight trends and patterns in large datasets visually.
- Add-ins: Leverage statistical add-ins for more advanced predictive modeling capabilities.
What are the key considerations when choosing HR analytics software?
When selecting HR analytics software, consider these key factors:
- Integration capabilities: Ensure compatibility with existing HR and business systems.
- Scalability: Choose a solution that can grow with your organization’s needs.
- User-friendliness: Opt for intuitive interfaces that non-technical users can navigate.
- Customization options: Look for flexibility in creating custom metrics and reports.
- Data security features: Prioritize robust security measures to protect sensitive HR data.
- Reporting and visualization tools: Evaluate the quality and variety of built-in reporting options.
- Mobile accessibility: Consider solutions that offer mobile access for on-the-go analytics.
- Vendor support and training: Assess the level of support and training provided by the vendor.
- Cost and ROI: Evaluate the total cost of ownership against expected benefits.
- Compliance features: Ensure the software supports relevant data protection and labor law compliance.

